|
Results of the 1860 Census
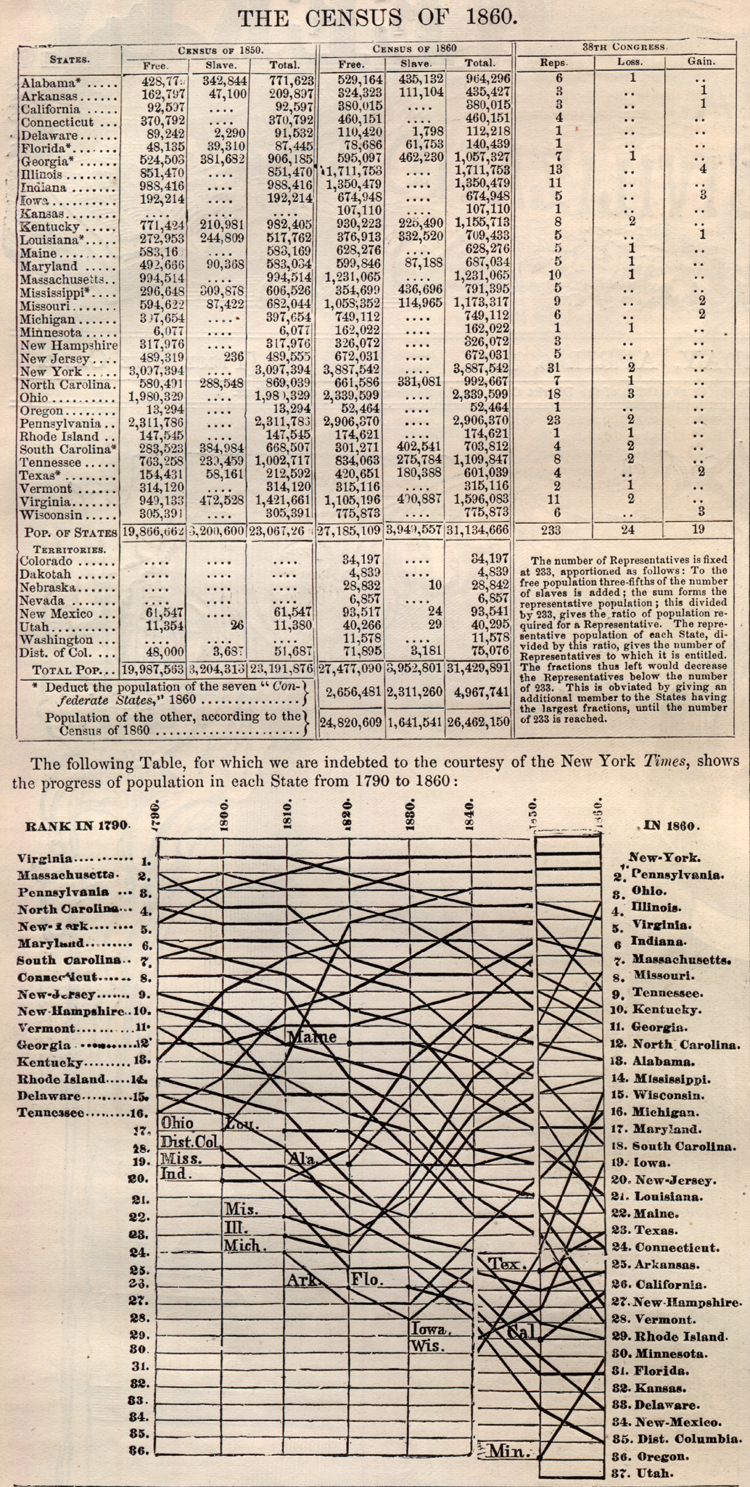
These are the original results of the 1860 United States Census.
They show the population of Free and Slave in each State and Territory
in the United States. The table is from an original 1861 Harper's
Weekly newspaper. The table also shows the states with growing and
decreasing populations since 1790. It also gives some detail on the
impact on the House of Representatives in Congress, and makes reference
to Slaves counting as 3/5 of a person. The newspaper includes the
following article which accompanied this table.
HARPER'S WEEKLY.
SATURDAY, APRIL 6, 1861.
THE CENSUS OF 1860.
THE Census Tables have at length been completed at Washington. The
preceding analysis shows the population of the United States according
to the Census of 1850 and that of 1860, together with the
Representatives in the 38th Congress, and the losses and gains in each
State. The great increase of the past ten years has been in the Western
States. The population of Illinois and Wisconsin has doubled ; that of
Iowa has nearly trebled; that of Michigan has nearly doubled. The exact
increase has been 90 per cent. in Michigan, 101 per cent. in Illinois,
154 per cent. in Wisconsin, 251 per cent. in Iowa. The older Western
States have not gained as much ; Ohio shows an increase of 18 per cent.
only; Indiana 37 per cent. The Middle States—New York, New Jersey, and
Pennsylvania—have increased 26 per cent. The New England States have
only increased 15 per cent., less than the natural increase ; Vermont
and New Hampshire have stood still. The border Slave States have
increased 28 per cent. in white, and 14 per cent in slave population.
The seceded States 33 per cent. in white, and 31 per cent. in slave
population. These figures illustrate the gradual migration of our
people, North and South, from the old to the new lands.
The second table published above shows how New York has steadily risen
to be the first State of the Union, and is followed closely by the other
great Central States, Pennsylvania and Ohio. Virginia, which was the
first State for the first quarter of a century of our national
existence, has now fallen to the fifth place. Massachusetts was second
in line at the time the first census was taken, but soon fell, and now
occupies the seventh rank. Pennsylvania has held her own better ; she
was third in 1790, and is now second. The fourth State, when the first
census was taken, was North Carolina, and the seventh South Carolina ;
they are now respectively twelfth and eighteenth. Maryland has fallen
from the sixth to the seventeenth place ; New Jersey from the ninth to
the twentieth ; New Hampshire from the tenth to the twenty-seventh ;
Vermont from the eleventh to the twenty-eighth ; Rhode Island from the
fourteenth to the twenty-ninth. So the older States are thrust out of
their original rank by their younger, more fertile, and more thriving
sisters. |